Optimize your Marketing Mix and Improve your ROI and Cost Efficiency

Marketing Mix Modelling

What is Mi.MMM

Understand the Real Impact of your Marketing Activities

Mi.MMM is an automated modern marketing mix modelling  solution for marketing managers, CMOs and other executives with marketing and revenue responsibility to understand and measure the incremental value of marketing and to optimize the budget allocation in order to significantly improve their marketing ROI.

Mi.MMM is designed to help you solve today's key challenges in measurement and marketing cost efficiency

Get clear recommendations for a more effective budget allocation across online and offline channels

Challenge 1

Missing actionable insights For key Marketing questions

Despite having reports and analytics in every possible tool, marketing and revenue executives still don’t get actionable insights and answers to the key questions.

How much sales (online and offline) did each media channel drive?

How would sales be impacted if I made "X" change to my marketing plan?

How much incremental revenue do trade and promotional activities drive?

How should I allocate budget by channel in order to maximize my KPIs?

What is the optimal level of spend for each marketing channel?

Where should the dollars come from if I needed to cut my marketing budget by X %?

Challenge 2

Measuring and optimizing ROI is becoming more difficult

  • iOS 14 changes
  • 3rd party cookies deprecation
  • Consumer moving between online and offline all the time
  • 10+ internet connected devices per household on average
  • Explosive growth of marketing tools each having their own reporting methodology to “prove” their value
  • Decline in trackability making difficult to get reliable insights from Multi-Touch Attribution tools

Example Results with an Online European DTC Brand

Identify Hidden Opportunities for Growth or Cost Savings

Channel ROI results

Improvement by using a different budget allocation (same total, but redistributed among channels, accounting for diminishing returns):
+ 14 % revenue

Features

Automated MMM Solution Based on Machine Learning

Budget Optimizer

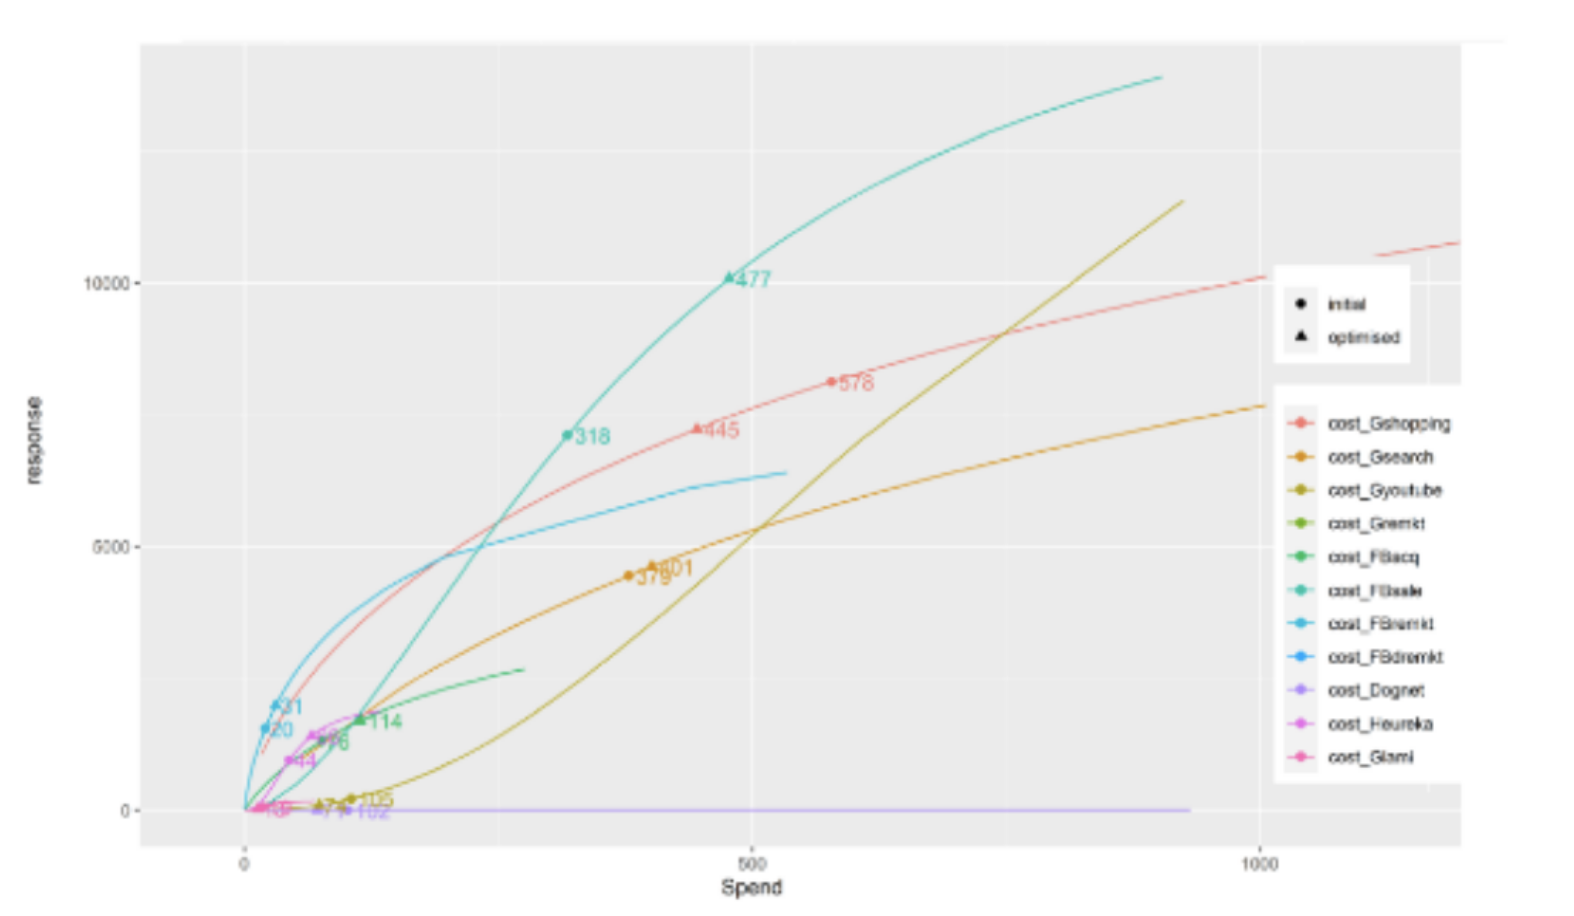
Find the best allocation of marketing budget among all channels to achieve best possible revenue.

Clear recommendations where you should increase / descrease spend and by how much.

Typical opportunity is 8-15% of cost savings.

Understanding incrementality

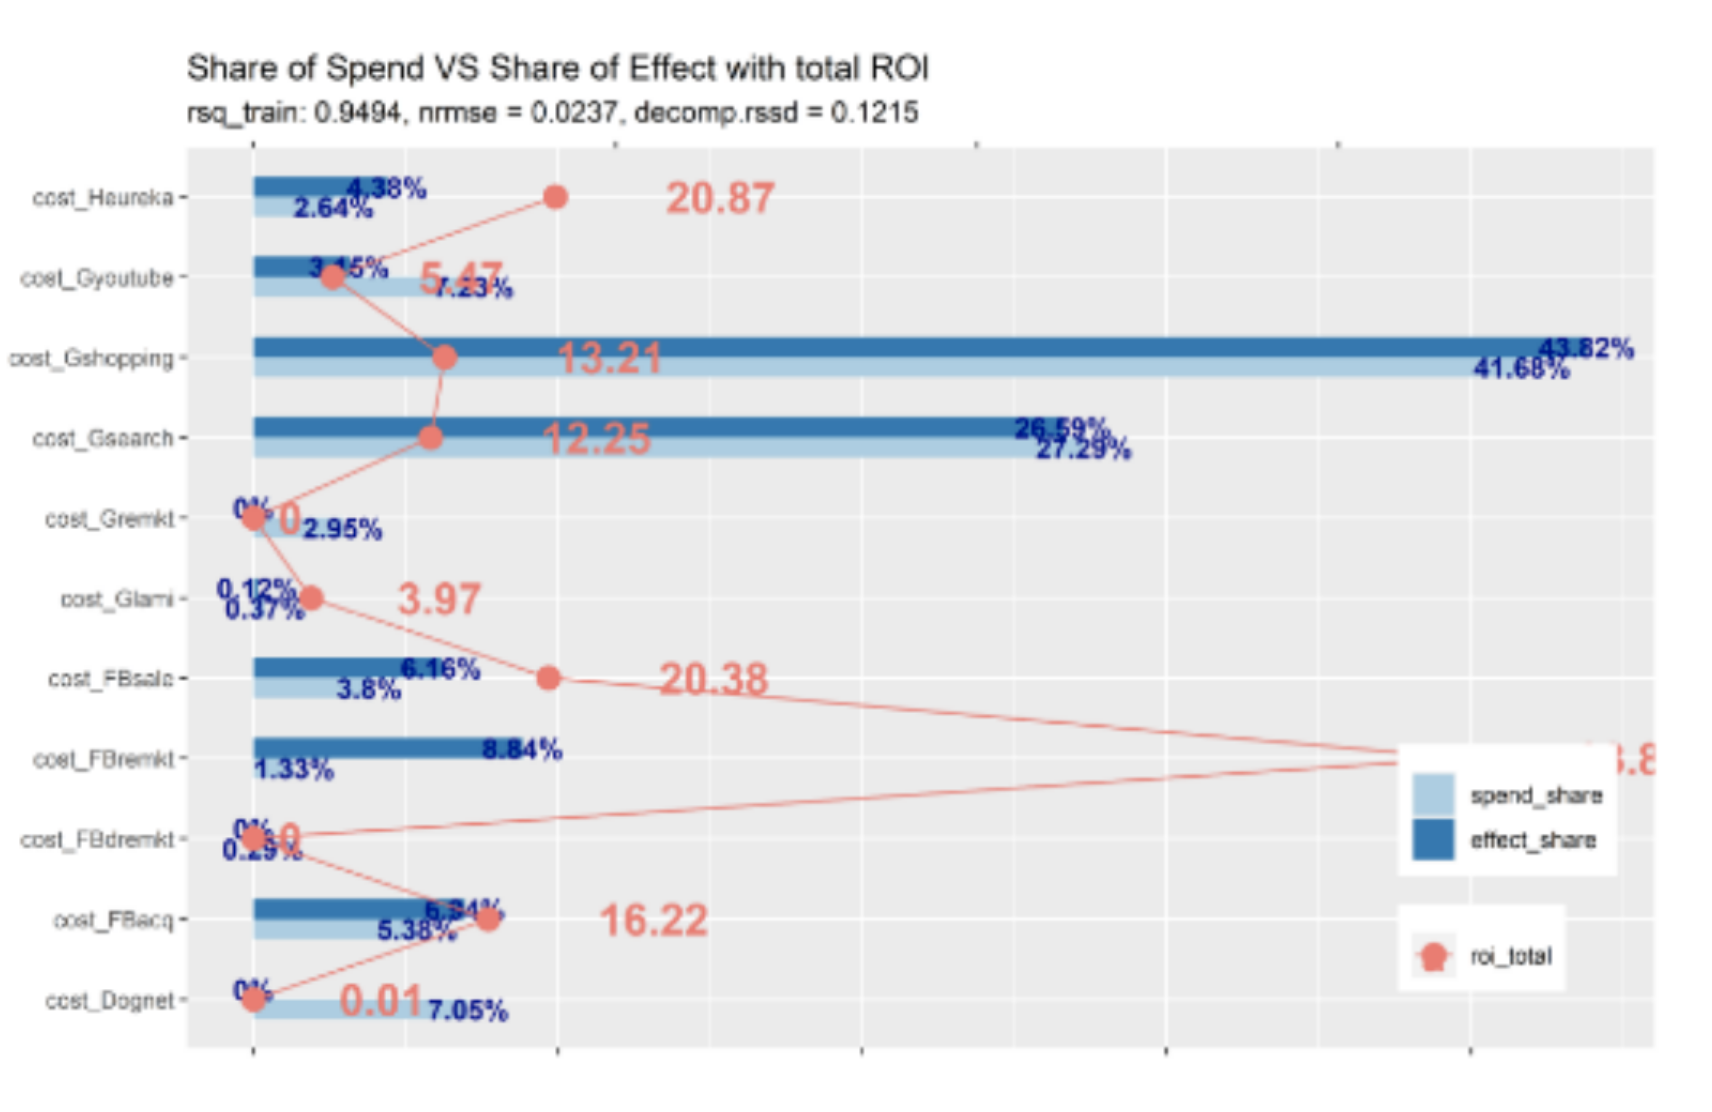
Identify true incremental effect on revenue (or profit or app installs or new customer acquisition…).

Mi.MMM can be calibrated using marketing tests and experiments for ground truth.

Identify and measure long term effect of brand building or other non-performance marketing activities.

Planning And Scenario Modelling

Model various scenarios “what would happen if I change investment in channel X by Y” using intuitive UI.

Try different constraints such as “Investment into TV can increase by 20% maximum over last year” and find best budget allocation given those constraints.

Incorporate expected changes in media prices.

Automated data Integration

Online media data, offline media data, external signals like weather etc – all can be ingested automatically.

Market and competitor level data.

Continuous Insights

Daily updated model results and insights available to you through UI and integration to leading BI tools (Tableau, PowerBI, Google Data Studio,…).

Results and signals from Mi.MMM can be integrated with your bidding platforms and tools.

Cookieless & Privacy-Safe

No need for user-level data or cookies-based data.

Privacy-first solution.

How Much Does it Cost

Pricing

Basic

$ 2499 one-time fee
  • One time MMM analysis
  • Data preparation and assessment
  • Comprehensive output with recommendations on marketing spend optimization
  • Executive summary for CMO
  • Workshop with our consultants to discuss results

Professional

$ 659 monthly
  • Automated MMM, daily updates
  • Budget optimizer
  • Tableau, PowerBI or Google Data Studio visualizations
  • Continuous insights and daily results update
  • 1 running model
  • Automated data ingestion + preparation
  • No long-term commitment
  • Support via email
  • No IT needed for implementation
Popular

Enterprise

Ask for a quote
  • For larger teams with custom data and analytics needs
  • Unlimited models (eg for multiple brands, countries or business KPIs)
  • Custom optimization tasks
  • Dedicated consultant / analyst
  • Regular insights and recommendations for your marketing team
  • Internal team training
  • Enterprise-level SLA
  • Cloud or on-premise deployment

Resources

Marketing Mix Modelling and Attribution Modelling have the same basic goal: measure the business impact of marketing channels and find out how to allocate marketing budget between channels in order to achieve the best possible results. The key difference between the two methods is that MMM analyzes effectiveness of marketing budget distribution from a top-down perspective, while attribution models are calculated at the level of a specific user (bottom-up approach). 

Let's Talk

Get in touch with Marketingintelligence team

Implementation package - MMM One-time

Get in touch with Marketingintelligence team

Implementation package - MMM Basic

Get in touch with Marketingintelligence team

Implementation package - MMM Enterprise

Get in touch with Marketingintelligence team

Get a Free Consultation or Additional Info

Do you want to get more information about MMM or how/whether it could help your ROI & measurement issues? Lets us know – we can either answer your additional questions, share more materials with you or have a quick call if you prefer.

Choose the Right Tier for You

PREMIUM

Choose the Right Tier for You

STANDARD

Choose the Right Tier for You

GROWTH

Choose the Right Tier for You

STARTER

Coming Soon

Predictive analytics in GA4

One of the new and exciting features of GA4 is called “predictive metrics” – with these you can learn about your customers and their shopping behavior. These are added automatically to your data and are based on Google’s machine learning expertise.

GA4 currently includes the following predictive metrics:

  • Purchase probability: The probability that a user who was active in the last 28 days will log a specific conversion event within the next 7 days.
  • Churn probability: The probability that a user who was active on your app or site within the last 7 days will not be active within the next 7 days.
  • Predicted revenue: The revenue expected from all purchase conversions within the next 28 days from a user who was active in the last 28 days.

You can create audiences based on these values and leverage them in your advertising campaigns – for example, you could exclude users who have a high purchase probability as you may assume that these users will buy anyways and you don’t have to spend additional marketing dollars on them (test it) or try to win back an audience with higher churn probability with a special campaign or communication.

Data export to BigQuery

Google BigQuery is a cost-effective and highly-scalable cloud data warehouse optimized for high performance on very large data sets. With GA4 you can export all your event-level data to BigQuery for additional analytics or data science initiatives.

Example use cases might be

  • Joining GA4 data with other sources in your company – CRM, customer data, backend sales, and margin data.
  • Using GA4 data for advanced customer analytics for a better understanding of customer lifetime value or churn prediction.
  • Automate reporting in your BI tool.
  • Move the data to your on-premise or cloud data lake and data warehouse.

You will need to have a Google Cloud account set up and maintained for this purpose. That is why we are here and can solve all the infrastructure for you and with you!

Free data driven attribution in GA4

Since 1/2022 GA4 has made a data-driven attribution model available to all users – unlike in Universal Analytics where the DDA model was only available to GA360 customers.

DDA is an algorithmic attribution model that quantifies the value of each touchpoint in the user journey (such as campaign click) and it does so by smart modelling behind the scenes without human bias that is always present in rule-based models.

The DDA model in GA4 is also better than the one on GA360 as it takes into account up to 50 touchpoints in the user journey vs. the GA360 only took 4 touchpoints.

It is also possible to set the default attribution model to DDA (or another model) from the old Last Non-Direct Click. And then all your reports and data exported to BigQuery will use the newly selected model as default.

DDA in Google Analytics 4 excludes almost all direct visits from receiving credit – you may or may not like that, but as it’s been always the case with attribution we recommend validating any model using marketing experiments.

World without Cookies and GA4

GA4 is built for a world where more and more users opt out of cookie consent and other methods for data collection.

Google uses machine learning modeling to fill in the data gaps – some of these are already in the current GA4 others will be deployed in the future.

For example, modelling conversions allows GA4 to properly attribute conversions without user identification – this is crucial for optimized advertising campaigns and automated bidding. This covers situations such as some browsers limiting the time window for first-party cookies, conversions for unconsented users, Apple’s App Tracking Transparency (ATT) impacts, cross-device user behaviour, and others.